Dashboard
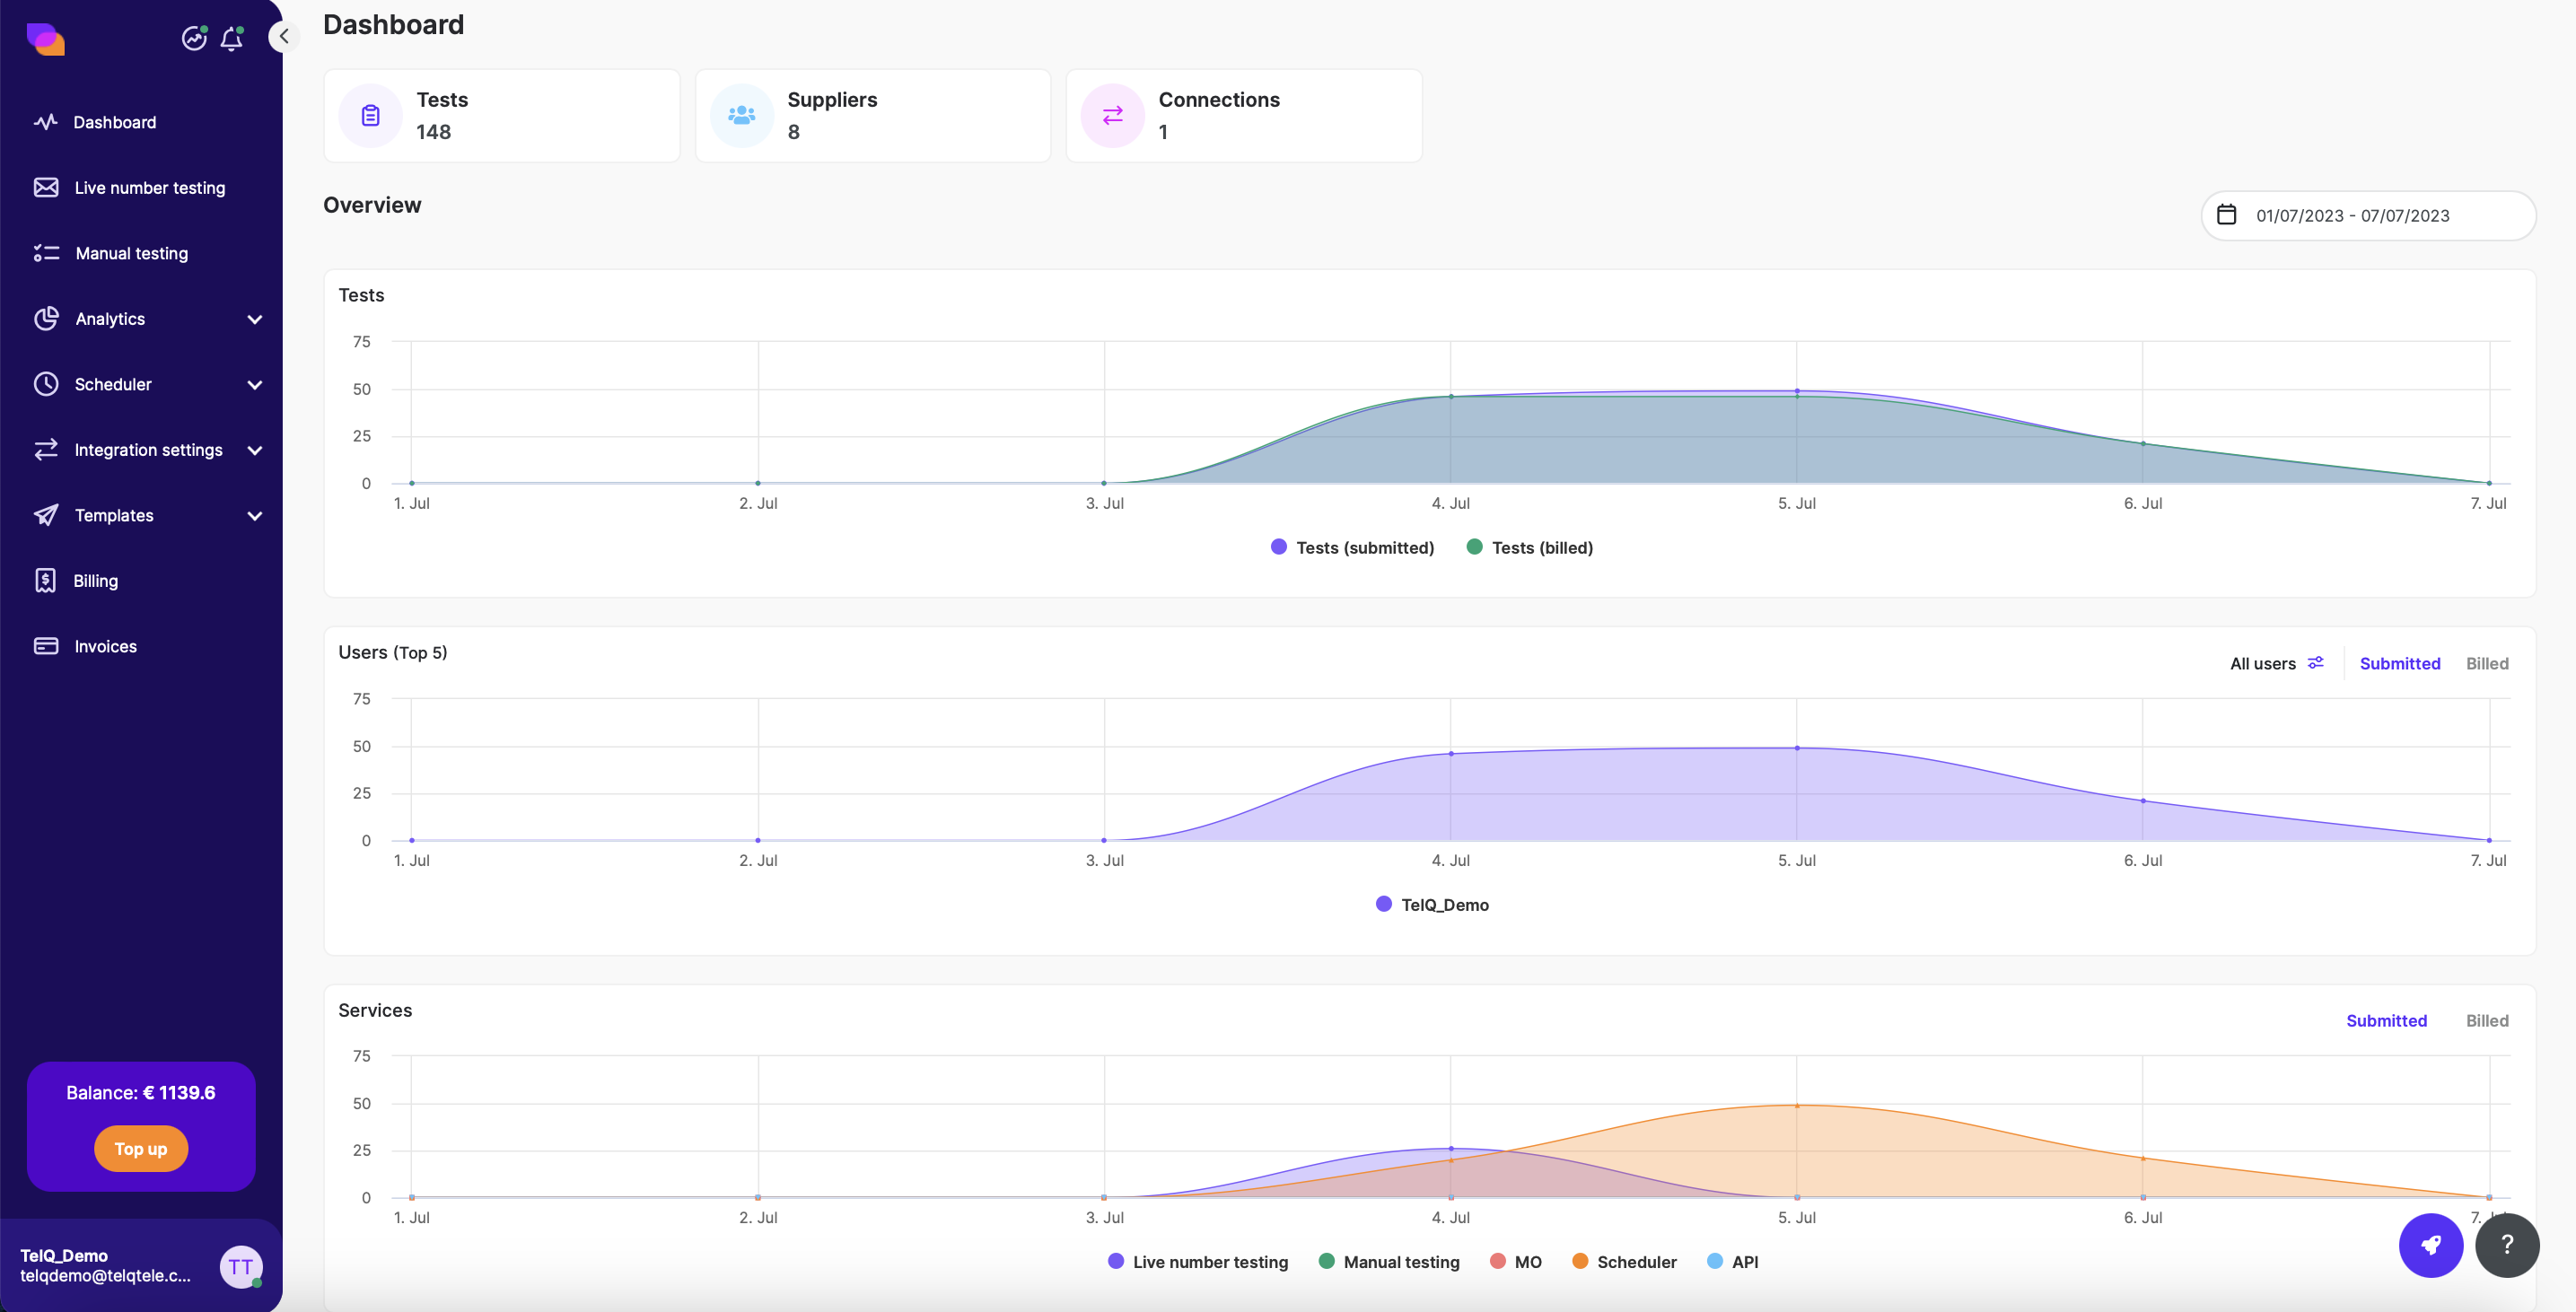
In this section you will be able to see the overview of your testing traffic. The graphs show:
number of tests submitted and billed
number of tests submitted and billed per User (top 5 users are shown)
number of tests submitted and billed per integration method
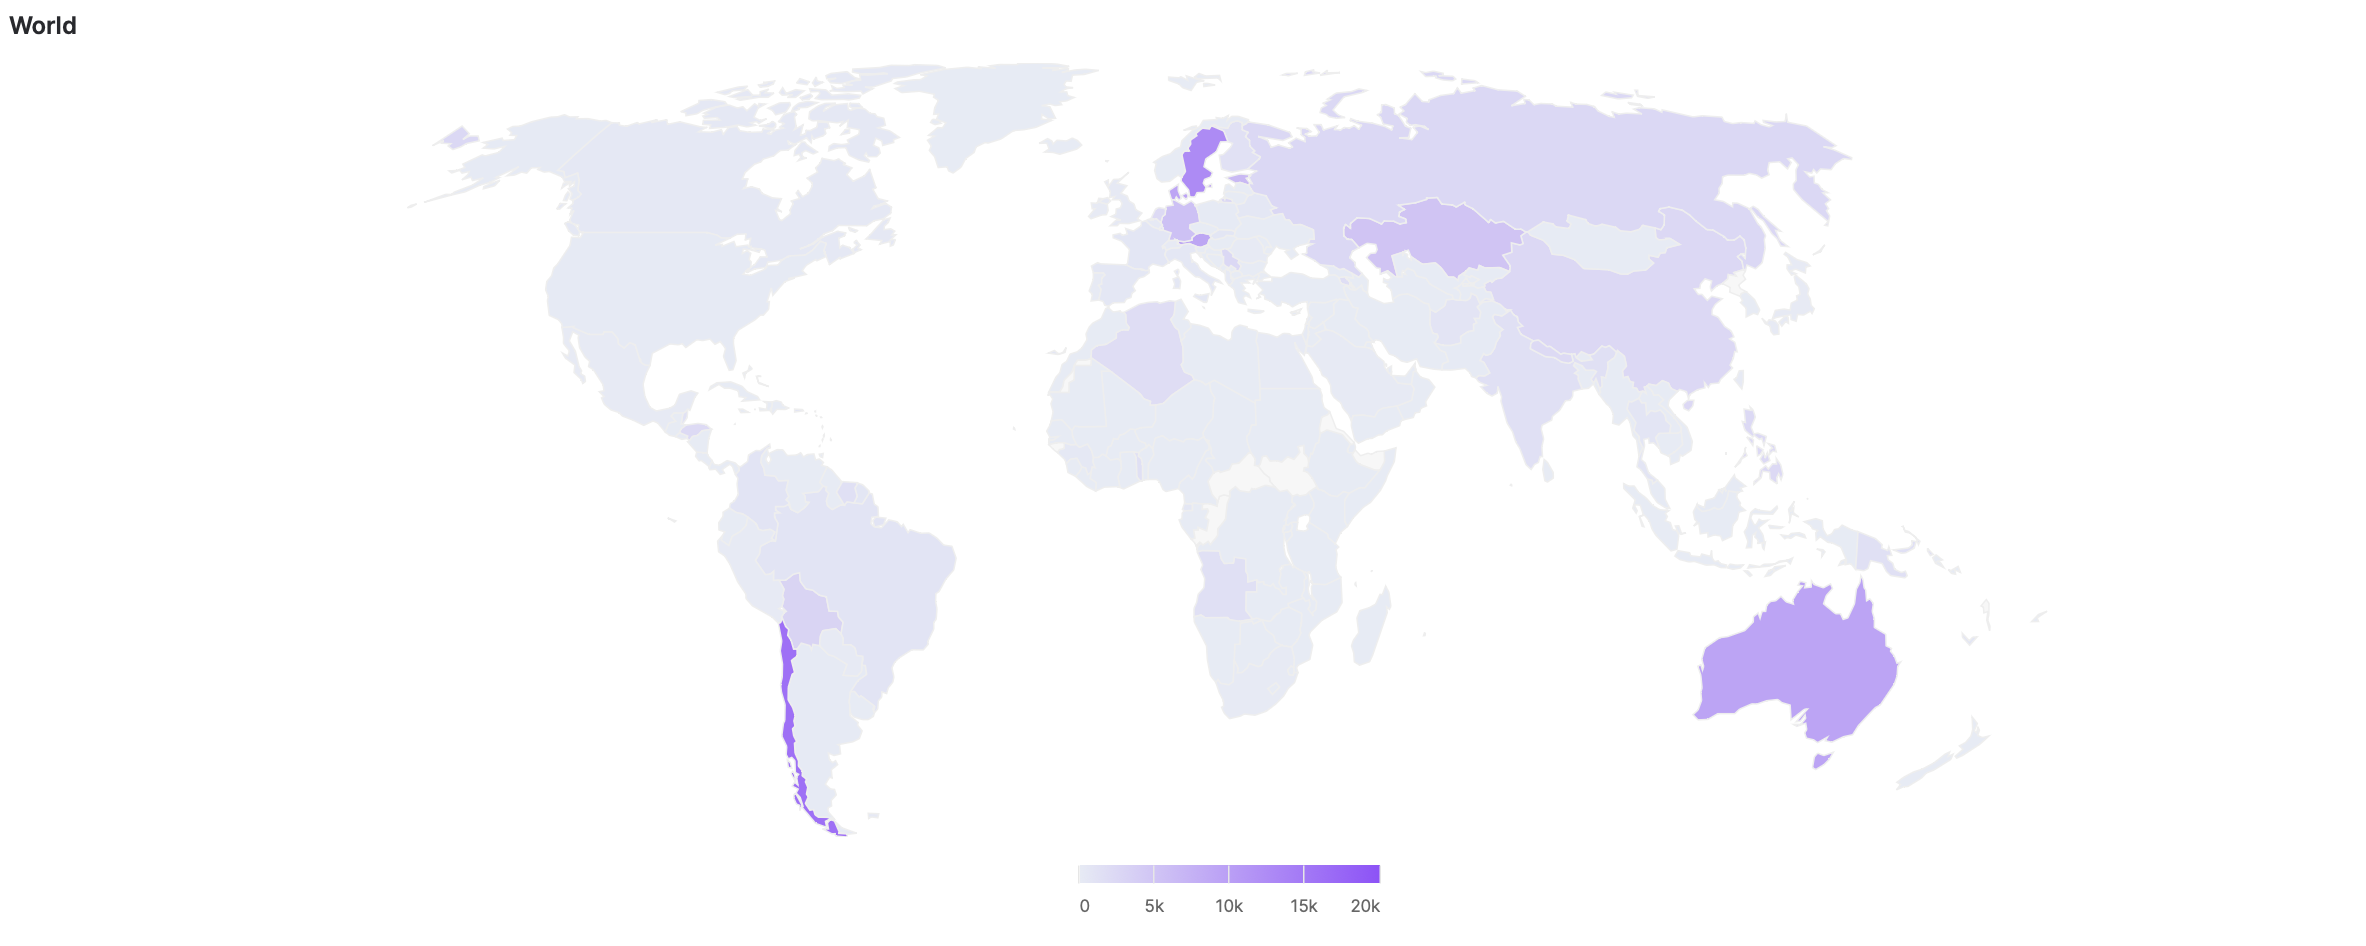
map of countries tested
All the stats can be updated based on the time interval of your choice.